


Are you tired of feeling lost in the endless sea of content creators on YouTube, struggling to make your business stand out? You’re not alone. While content creators focus on entertaining and retaining viewers, your goal is to attract potential clients and customers to your offers. So how do you carve out your space on YouTube and ensure your efforts translate into tangible results for your business?
That’s where our collaboration with Databox comes in. We understand the unique challenges business owners face on YouTube, which is why we’ve partnered with Databox to create a benchmark group exclusively for business-focused YouTube channels. This initiative provides a solution tailored to your needs, offering invaluable insights and benchmarks to guide your YouTube strategy.
Joining our benchmark group grants you access to real-time data from over 350 business-focused YouTube channels and growing. With this anonymized data, you can compare your performance against industry benchmarks, identify strengths and weaknesses, and make informed decisions to optimize your YouTube strategy. Plus, it’s completely free and anonymous, so you can participate without any concerns about privacy or data sharing.
Ready to take your YouTube marketing to the next level? Dive into our benchmark data for March 2024 below and discover how you can elevate your business’s presence on YouTube.
HOW TO READ THE BENCHMARK CHARTS
Before I share some of the data we compiled here is how to read the benchmark charts. In our Benchmark Group, you will see charts similar to the one below. use the information below to help you understand the benchmark data.

The blue vertical line represents a company’s performance in the previous month. For this company, it shows 2,400 pageviews. The chart also shows the following:
- The bottom 25% of performers for this metric had below 1,800 pageviews.
- The top 25% of performers had above 3,200 pageviews.
- The median value is 2,100 sessions, which means that 50% of companies had more than 2,100 sessions in the previous month, and 50% had less.
- The height of the green chart shows the frequency at which someone had the value that’s shown on the horizontal or x-axis. For example, in this chart, a relatively large % of the population had pageviews of around 2,000 last month, as that’s where the peak of the chart is.
Now that you know how to read the charts, let’s dive into some of the actual data from our group below. You can also join the group for access to the rest and to see up-to-date data and historical benchmarks too.
YouTube Channel Performance Benchmarks for Businesses
In our benchmark group, we focus on analyzing important metrics specific to YouTube. This group collectively shares data on nine crucial metrics. In this blog post, we’ll highlight three key metrics: views, average view duration, and average percentage viewed.
Understanding Views: How Far Does Your YouTube Content Reach?
When examining the views metric, we’re essentially measuring the number of times a video has been watched. Based on data from our benchmark group comprising over 350 business-focused YouTube channels during March 2024, the median views for the month stood at 2.98K.
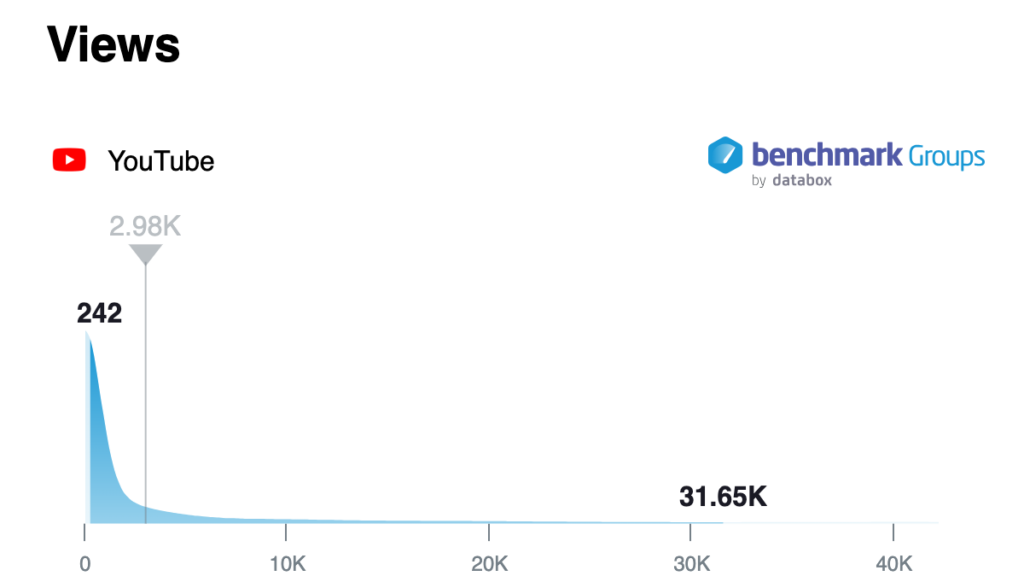
The distribution of views varied within the group. The bottom 25% of channels recorded below 242 views, while the top 25% surpassed 31.65K views. There was a notable concentration of channels around the 242-view mark, as evidenced by the peak in the distribution chart.
If your channel earned more than 2.98K views in March 2024, you outperformed over half of the benchmark group. However, views alone don’t provide the full picture of channel performance. Let’s dive deeper into how viewers engage with videos to gain a comprehensive understanding.
Exploring Average View Duration: Are You Keeping Viewers Engaged?
Let’s now shift our focus to another critical metric for measuring viewer engagement: average view duration. This metric indicates the average amount of time viewers spend watching your videos—an essential factor in assessing content effectiveness.
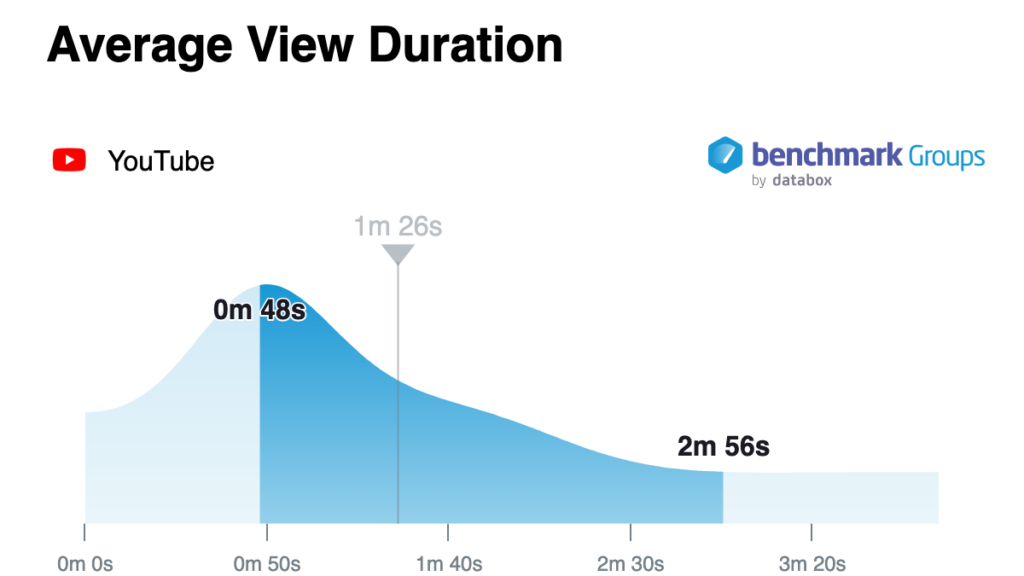
According to data from our benchmark group, the median view duration among business-focused YouTube channels was 1 minute and 26 seconds. This figure offers valuable insight into the typical viewer engagement levels within our contributing channels.
Diving deeper into the data, we find that the bottom 25% of channels recorded an average view duration of less than 48 seconds, while the top 25% boasted durations exceeding 2 minutes and 56 seconds. This distribution highlights the wide range of engagement levels observed across our benchmark group.
If your channel’s average view duration for March 2024 surpasses 1 minute and 26 seconds, congratulations—you’re outperforming half of the benchmark group in terms of viewer engagement. Now that we have a clearer understanding of how long viewers are engaging with business YouTube channels, let’s explore how this duration compares to the actual length of the videos.
Analyzing Average Percentage Viewed: How Engaging Is Your Content?
The average percentage viewed metric offers valuable insight into how effectively your videos engage viewers relative to their length. Unlike average view duration, which measures the total time viewers spend watching a video, average percentage viewed takes into account the video’s length, providing a more nuanced understanding of viewer engagement.
For instance, if your video has an average view duration of 2 minutes out of a total duration of 24 minutes, your average percentage viewed metric would be approximately 8%. This metric indicates the proportion of the video that viewers typically watch and can help gauge audience interest and engagement levels.
According to our benchmark group data, the median percentage viewed among business-focused YouTube channels is 39.84%. This figure serves as a benchmark for assessing viewer engagement across the platform. Breaking down the data further, we find that the bottom 25% of channels could only retain viewers for less than 24.4% of their video, while the top 25% were able to keep viewers engaged for over 54.35% of their video on average.
Understanding your channel’s average percentage viewed can provide valuable insights into audience engagement and help identify areas for improvement in your content strategy.
Get Your Free YouTube Benchmark Report
Ready to uncover valuable insights and elevate your YouTube channel’s performance? Sign up now for full, free access to our Databox-powered benchmark group, where you can compare your channel against over 350 business-focused YouTube channels. Gain actionable insights to refine your content strategy and attract quality viewers.
Alternatively, book a free benchmark consult to receive personalized guidance on optimizing your YouTube strategy.
Discover Effective YouTube Strategies for Businesses
Are you curious about the YouTube strategies employed by top-performing business YouTube channels? Take part in our survey to gain valuable insights directly from business owners and marketing leaders like yourself.
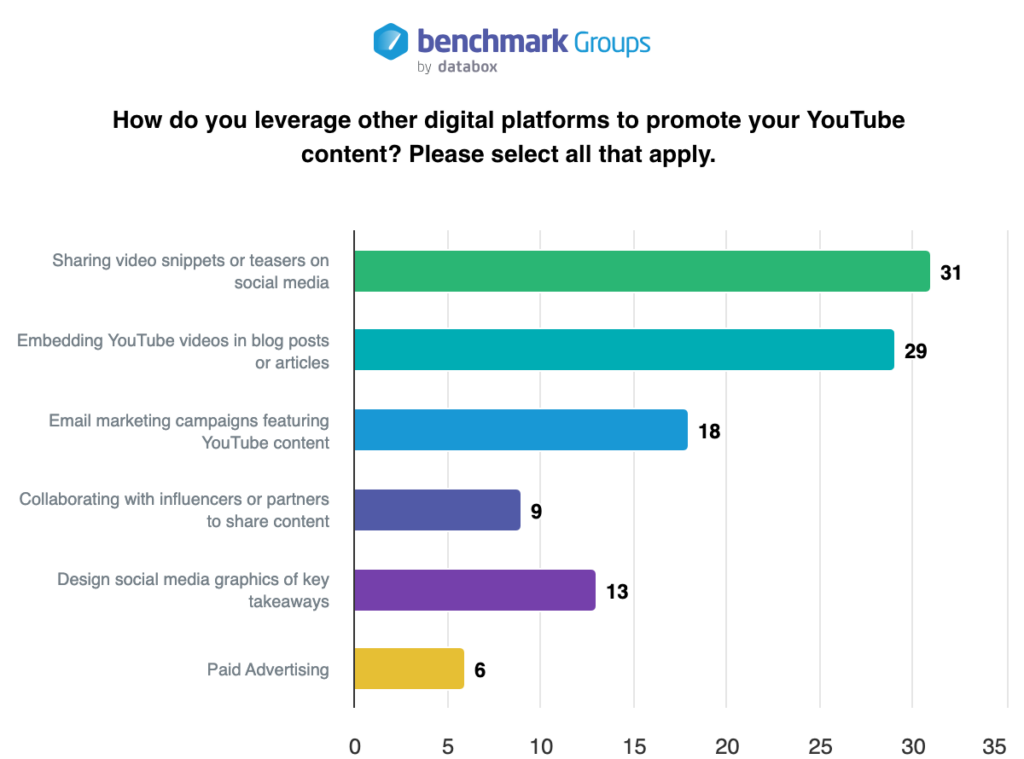
Here’s a sneak peek from one of the survey responses: A small percentage of respondents are leveraging their YouTube videos to create other social content. Could this be a missed opportunity to expand their sales funnel?
This collaborative research initiative with Databox aims to gather insights specifically from business owners and marketing leaders who incorporate YouTube into their company’s marketing strategy. By participating, you’ll contribute to valuable industry research and gain access to exclusive findings.
Ready to share your insights and learn from others in the industry? Click here to participate in the survey now!
Your response could be featured on our blog and social media platforms, providing valuable exposure for your company and insights into your YouTube strategies. Join the conversation today!
Jamar Diggs is a YouTube Marketing Strategist for small businesses and brands who want to leverage YouTube to create a low-lift marketing strategy so they can make marketing only 10% of their focus. He takes his corporate marketing experience from working in large marketing departments like Homes.com and Forrent.com to help his clients create a content strategy and marketing system that will generate results for years.


Comments +